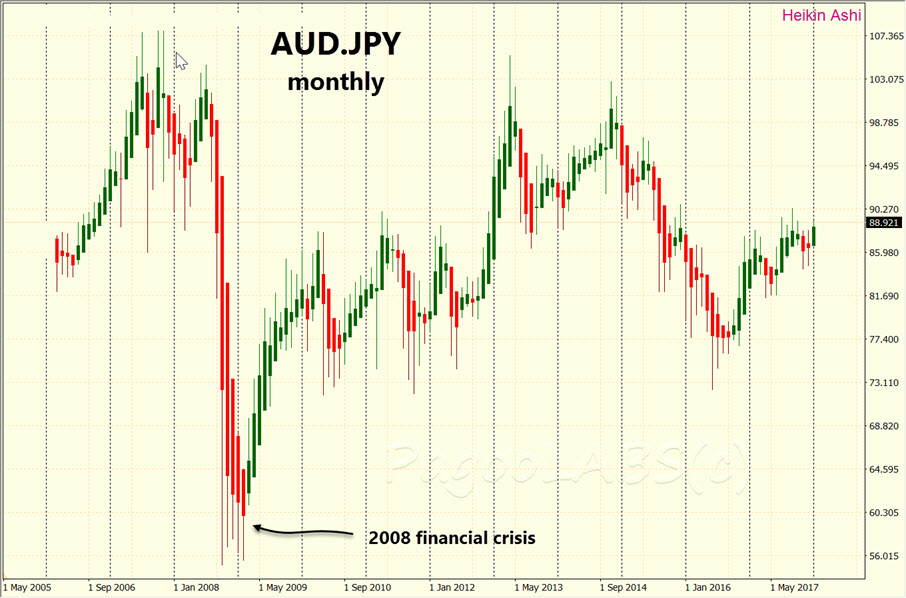
First let's take a look at the long term chart of AUDJPY, going back to before the 2008 financial crisis.

The first thing that stands out is the lack of any meaningful trend. All the price action has been contained within the extremes of the 2008 event. In an earlier story I discussed how to move to a shorter timeframe when no trend was clear on the current one.
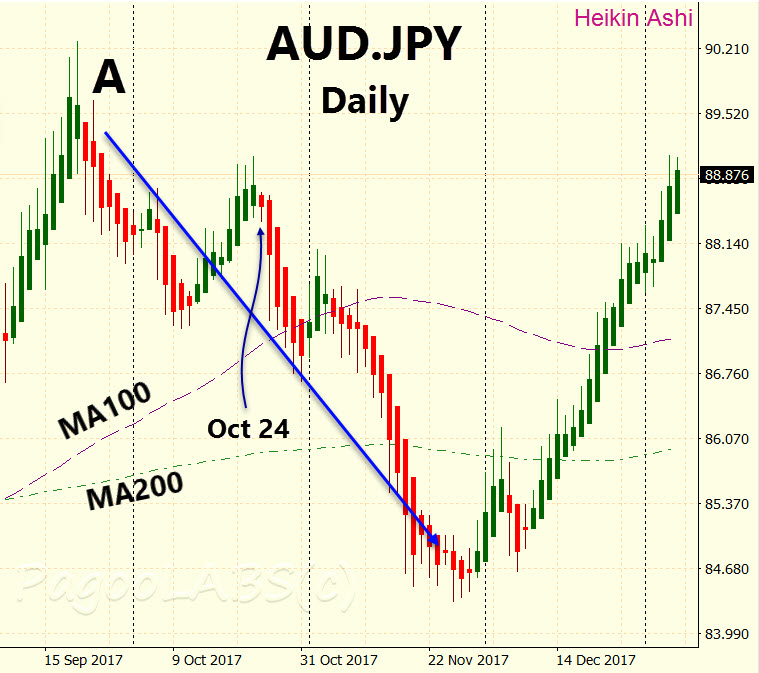
The weekly is just as aimless, while the daily timeframe has been sideways throughout 2017 with distinct legs up and down. From mid September we saw a good run down on the daily but not enough for the 100 and 200 period moving averages to confirm any down trend.

If we focus just on the daily chart and the leg down that started mid September 2017, marked A above, we could say that we have some evidence that a down trend is underway. Now, obviously, this is not enough evidence to short this daily AUDJPY, but it may be supporting evidence for a shorter timeframe. By the time the chart ends in early January 2018, it becomes clear there was no down trend, just a continuation of the sideways behavior noted above.
However on October 24th the market stamped out a lower high and an HA reversal. As I have pointed out in earlier stories, reversals only make trading sense in the presence of a trend. On October 24th, we did not know the future so the question was, what were the consequences of using this information on a shorter timeframe, say the H4?
The supporting evidence is not strong enough to support a trade placed here but given that our earlier stories written around this time used the AUDJPY pair as an example, let's investigate further.
To be consistent we would have to close out any short trades still open in our system as soon as the daily HA reverses upward (turns green). That happened on November 30th. So we are looking to trade short in the period October 24th until November 30th inclusive.

Here, as in the earlier stories, I am assuming a risk-return multiplier of four. This means we automatically close winning trades when they reach four times risk. Whichever method you use to calculate TP, it should emerge from the simulation step where it is the optimum multiplier for a large number of simulations in your market of interest. In the cases I have examined using Heikin-Ashi reversals in a trending forex market, that key risk multiplier is a little less than four. I will continue using four below, but your optimal multiplier will depend on your precise strategy. Calculating the risk multiplier is discussed here.
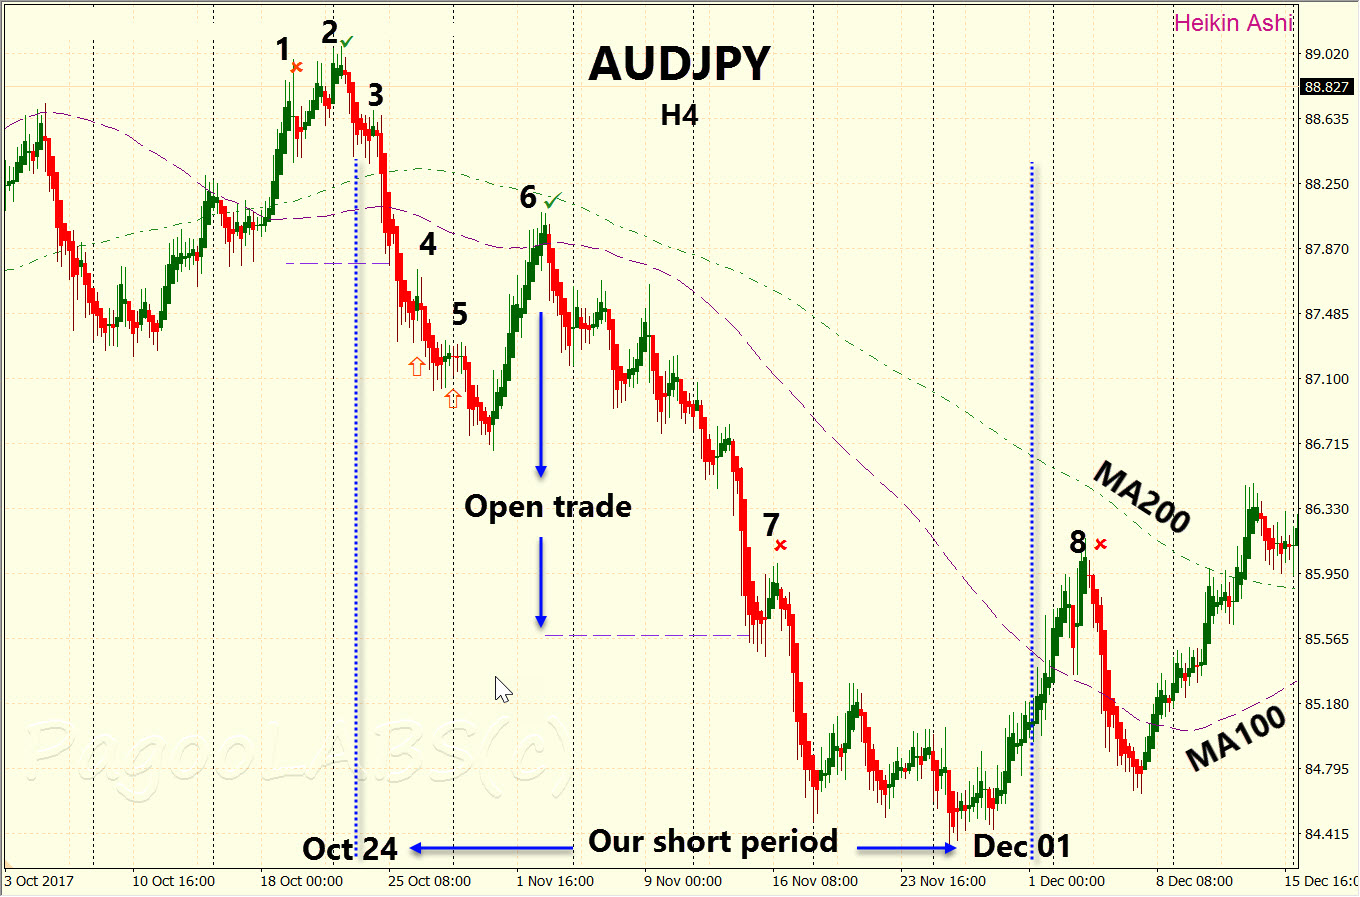
Looking at the H4 Heikin Ashi above, we can see the shorting period extracted from the daily. The first thing to note is that the period critically satisfies some of the basic down trend characteristics we have seen in a number of our earlier stories:
- the MA100 has already crossed below the MA200, indicating a down trend
- both MAs are sloping down
- the longer timeframe, as mentioned above, is in a Heikin-Ashi down trend.
Looking over all the Heikin Ashi reversals around the shorting period, we have 8 possible trade setups to consider. Not all of them will result in a trade:
| Setup number | Trade Comments |
|---|---|
| 1 | Not opened - before the short period starts |
| 2 | Not opened - before the short period starts |
| 3 | Not opened - red bar is not after a retrace |
| 4 | Not opened - red bar is not after a retrace |
| 5 | Not opened - red bar is not after a retrace |
| 6 | Opened - results in a win of 4 x risk |
| 7 | Opened after #6 closes - loss after failing to trigger TP |
| 8 | Not opened - after the short period ends |
If some of these comments are confusing, you might like to look back on earlier stories where the basic trade setup filters are covered. Remember that while #6 is open, no other trades can be simultaneously opened otherwise the trade risk will be greater than 2% of our funds.
Because the daily HA reversal does not finish until close of trading on November 30th, all open shorts should be closed at the open on December 1st. Following this rule, the final trade would be a gain of about 1.5 times risk rather than a loss but I will count it as a loss so as not to inflate the success of the strategy and also because until now I have always advocated holding until the SL or the TP has been triggered. I have not yet discussed any other reason to close early because, quite frankly, getting into the habit of closing open trades for any other reason is a killer of trading profits.
Although the longer timeframe indicated a down trend, the H4 only allowed two trades to open, one win and one loss. However, and this is a key to successful trading, the win was greater than the loss. In this case the win was four times the only loss, resulting in the strategy winning three times your allocated risk. If you allocated 2% of your funds at risk to this strategy, you just made 6%. Not bad for five weeks.
Nowhere here do I advocate you follow such a naive Heikin Ashi reversal system. The point is to show you how to construct your own without relying on expensive, black-box Expert Advisors which often times simply drain your account.
So what happens after the daily reverses up, do we continue the strategy by trading longs on the H4? I leave that as an exercise for you. However, while you may be able to eke out a trading profit doing this, trading the AUDJPY at the H4 timeframe will remain hampered by the fact that this currency pair is not trending at longer timeframes.
As you can see, this systems approach depends on the trend and highlights the importance of correctly identifying which direction the market is trading. It is an important clue that successful trading requires putting more effort into trend analysis than jumping from one indicator to another. The Heikin Ashi signal used here is not a required indicator. You could almost use any other. All that is required is that you open each trade consistently and follow all the rules you have already established in the simulation testing stage.
Copyright (C) PagooLABS 2018. All Rights Reserved.