Trading Systems Part 2
The previous story introduced trends and showed how to recognize them using higher-high and higher-low cycles, (HH-HL, or LH-LL in downtrends) and moving averages. Here we will look further into timeframes and fundamentals to see how they affect the trend.
In some cases a trend can be almost indistinguishable from a sideways pattern. Cases like this are to be avoided because if other traders in the market lack conviction why should you be so convinced? Trade another market and come back to this one when the trend is more obvious.
Shorter Timeframes
Another alternative is to move your trading to a shorter time frame: what looks like a series of whipsaws going nowhere on the weekly, may look like a strong trend on the latest section of the H4 chart. Equally, you could move to a longer timeframe: what looks like a sideways market on the H4 may be just a small retrace forming in a steady trend on the weekly. Favor longer over shorter timeframes if you can.
Your charting software usually allows you to choose between various timeframes. The common ones include:
- one minute
- 5 minutes
- 15 minutes
- one hour
- 4 hours (H4)
- one day (D1)
- one week (W1) and
- one month
Each timeframe collapses all the trades for that period into one bar on the chart. The open and the close are the prices where the time period began and ended respectively, and the high and low are the trading extremes over the duration of the period.
In general you should aim to trade the daily. This allows you 24 hours to digest a single candlestick, which is often enough time to review the news. You will have several days at least between trades, enough time to recover from a failed trade as well as time to remind yourself after a successful trade that you are very much human. In ancient Rome a slave would whisper in Caesar's ear that he should "Remember, you are only a mortal!" while enjoying the adolation of the crowd during a victory triumph. A win is often a lot of money so never let success carry you away. It's just a trading system and sometimes it wins, sometimes it loses. A level head helps.
However if the markets are trendless on the daily or weekly charts, you might consider trading shorter timeframes where a tradable trend may be easier to see. Consider the Gold futures contract where gold has been consolidating sideways on the weekly chart after falling from its 2011 European crisis highs.
Here is how a longer timeframe (weekly) looks for the Gold continuous futures contract:
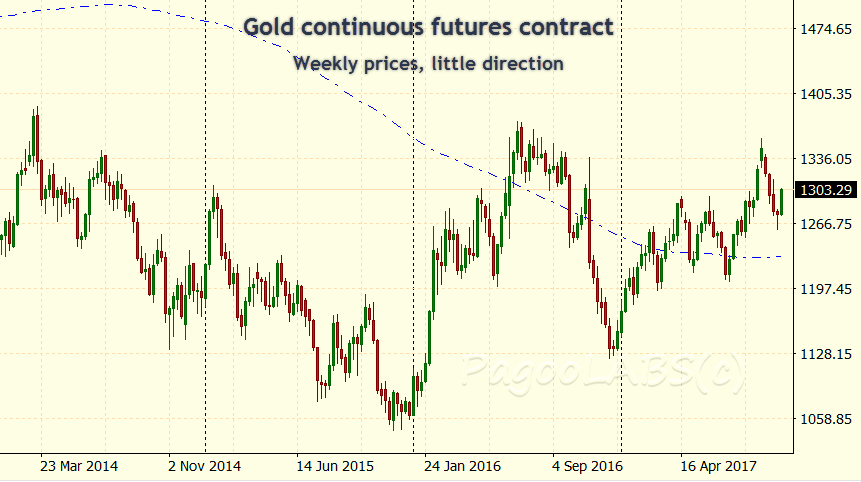
Those little wiggles in the chart look insignificant on the weekly but on the H4 they display a tradable trend: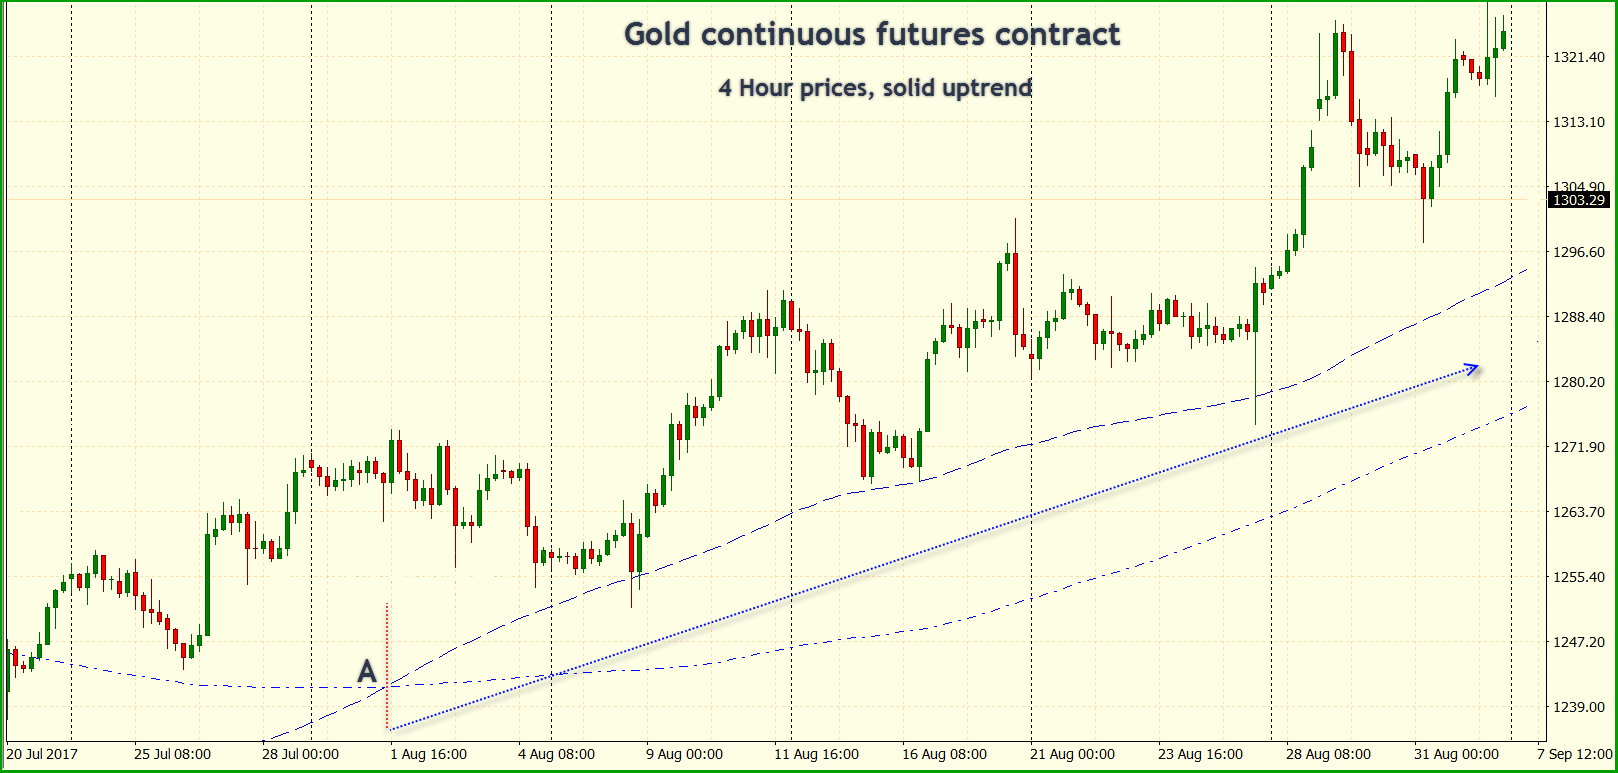
In terms of the basic operation of your system, nothing much changes in your setup, signals and system as you move to a shorter timeframe, other than the points I discussed above about analysis and recovery time. But there are some notable differences with shorter timeframes you must be aware of:
- Unless the system is automated or you have trading partners scattered across timezones trading the same system on the same portfolio, no human can trade 24 hours continuously without sleeping.
- You cannot assume the best signals occur while you are awake.
- You will therefore miss many signals.
- News that shocks the daily charts will so overwhelm the shorter timeframe that your stops can slip disastrously. Your system could be thrown into deep losses. Of course, the opposite may happen as well and you win, but then you are limited to a four fold win. Except for the very best, many brokers will force you to carry all losses but will turn on a dime to share in any gains should you win more than you expected.
- Bid/ask spreads and commissions become a bigger percentage of the trade.
- Margin comes into play because you will be buying more contracts given the closer stops and therefore the lower risk - see the series on "The Basic Setup" for an explanation.
Choose a timeframe that most suits your style, favoring longer over shorter timeframes where possible.
The Fundamentals and Trend
If you trade a market you owe it to yourself to become familiar with its news and the fundamental influences that drive it. If the instrument is trading in a bull market you should know why. As it changes direction, ask what fundamentals have now changed? Are they likely to last long enough for a trade? Ask yourself the same question every day. This is your best early clue to a change in trend.
In a very important sense, the trend is the longer term fundamentals. If prices in the economy are inflating, gold, oil and other commodities will be rising in price. Currencies of countries with prices rising faster will fall against the currencies of countries with more stable prices. At present (2017), inflation is low and lower than many observers expected a decade ago. In consequence, prices for gold and oil are lower than their peaks set at a time when prices were expected to rebound. Of course, there are other reasons for the fall in some commodity prices but keep your eye out for if and when inflation starts to re-enter the system.
The fundamentals and the trend should be in sync, and if they are not then you should be cautious about trading that market until they are. Also, different timeframes have different fundamentals. A minor news conference or statement from the Bank of Japan might send the Yen in a new direction on the M5 chart but result in less than a blip on the daily.
As technical traders we are accustomed to the rubric that all news is already in the prices. There is a lot of truth to that but we should still be aware of the major fundamentals driving the trend, not the day to day press conferences or occasional burst pipe line. When the trend changes, the prices will reverse direction but it may just look like a deep retracement in the early stages. Knowing the major fundamentals and how that affects the markets you follow will help you spot a changed trend or paradigm shift sooner.
Trend Reversals
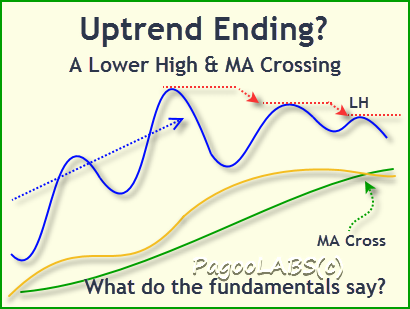 It is rarely clear when a previous trend is coming to an end and has begun to reverse direction. You could wait for a pattern of HH-HL or LH-LL to assert itself. Or you might wait for the faster (short timeframe) moving average to cross the slower. If you trade these markets you should have a good idea of the news in this area. What has changed in the fundamentals to cause this new market behavior? Does it look like these new fundamentals will be market drivers over the time horizen of your trades?
If you wait until a new trend is well and truly established, it may be too late to trade. These are normal issues that every trader has to grapple with. Follow rules that are consistent so that you can measure your performance and adjust if necessary.
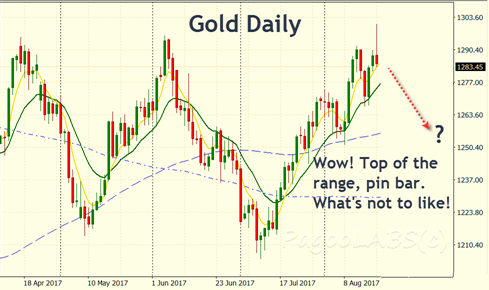
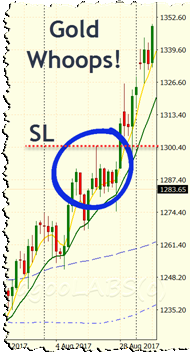 However, for long periods in a row, a trend can progress relentlessly in one direction. Based on probability alone, a series of smaller trades in line with the trend would be far more likely to succeed than guessing that one place where the trend finally ends. If you trade the trend then that last trade where the reversal triggered your stop would be a loss but all the earlier wins should offset that nicely. As you can see here above and to the right, what looked like a prominent pin bar in the Gold continuous futures contract, turned out to be one more bar continuing in the direction of the trend.
The one exception to this rule about not trading reversals should be those trading sideways markets, which I do not cover here.
While it may not be clear for some time that a trend has reversed, evidence nonetheless accumulates pointing to that conclusion:
- the fundamentals have changed
- coming out of a previous downtrend the market puts in a higher low and a higher high
- the moving averages cross, and
- possibly a candlestick reversal pattern is evident at the low.
Any one of these may not mean much but when several occur then its probably time to change over to a bullish strategy of buying the retracements. Evidence for a trend change applies equally at the start and at the end of a trend. Look to the much longer timeframe to see whether the new trend is likely to be a real trend reversal or a retracement.
Retracements against the trend
Within the trend, retracements occur regularly. On the charts above you can see these retracements between each HH and HL. There are many reasons for why prices do not move steadily in one direction but it's apparent that traders have widely divergent views about the interpretation of events as they occur in markets. Perhaps you are yourself conflicted about which way a particular item of news will send prices. There are two views right there! Profit taking by traders on their winning positions could itself reverse prices for a time.
Eventually whatever was fundamentally driving the trend will reassert itself, the short term profit taking will stop and stronger hands will hold on. The net effect is more buying pressure than selling within a bull market. The retracement comes to an end and the trend resumes.
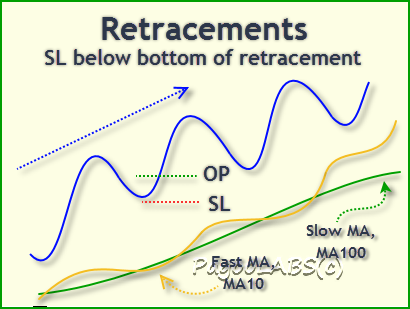 As you can see, this area where prices resume in the direction of the trend is an excellent place to enter a new position. We have a clear area where the market tested further price falls and for now rejected them. Retracements that signal a resumption in trend are valuable sources of the location of support and resistance areas. I will return to explore this area further in the next section on signals in Part 3.
When a trend reverses, it is not clear until much later when prices cut through previous areas of support or resistance. However when a retracement reverses it is from a higher low in a bull market (or lower high in a bear market) and you continue to trade with the trend. The more time you spend with charts the less chance of getting the two confused.
Summary
Trade the longer timeframes whenever possible. They give you plenty of time to analyze the market and make the necessary pyschological adjustments you need to risk your money on a trade.
Even technical traders should pay attention to the fundamentals as a guide to understanding the trend.
Do not confuse reversals of trend with a retracement coming to an end. Check the history of the chart to see if the market is setting a higher low in what was a downtrend (or lower high in a previous uptrend).
In the next story we will discuss how to receive a signal from the market. Signals are the heart of trading and typically include any special market price behavior that you have previously determined will trigger you to open a position. To do so, you will use the setup tools we have already discussed.
Copyright (C) PagooLABS 2017. All Rights Reserved.